See exactly what your agents are doing
Trace every run. Replay any step. Alert on latency spikes, cost anomalies, and tool failure rates before users feel them.
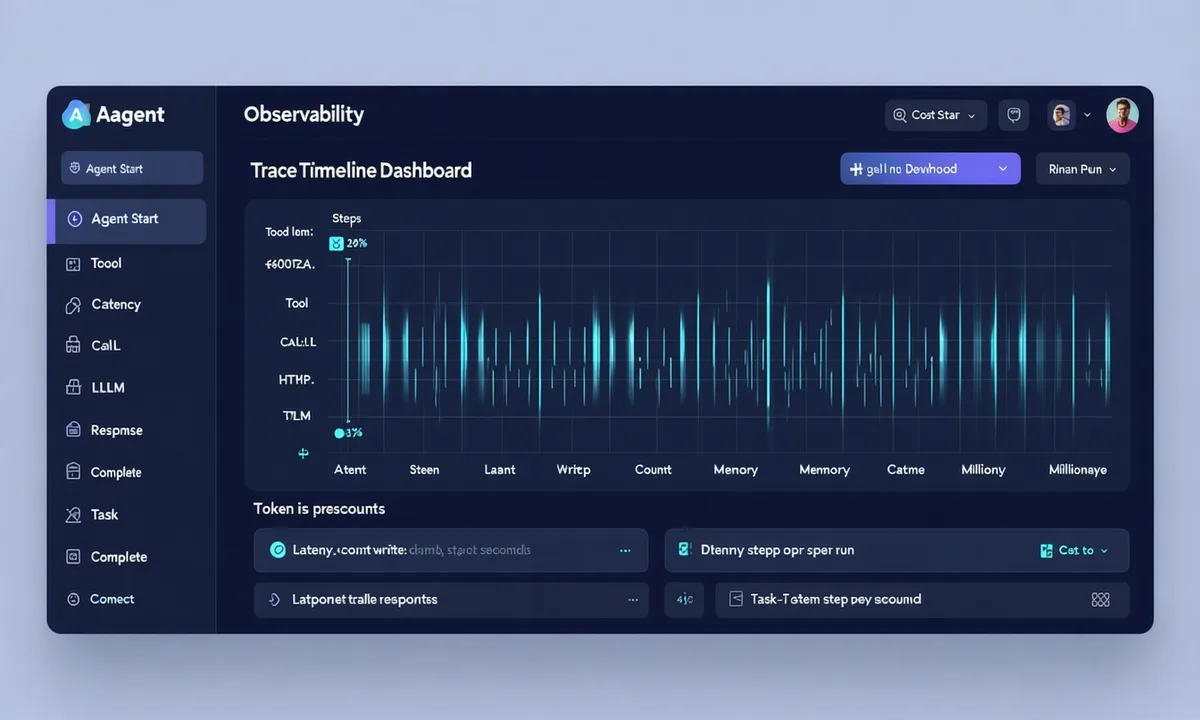
Step-by-step trace explorer
Every agent run produces a full execution trace — not just a log line. Each step shows: input, output, tool called, latency, tokens, and cost. Replay any step in isolation to debug without re-running the full pipeline.
- Per-step latency breakdown (p50 / p95 / p99)
- Token counts and USD cost per LLM call
- Tool call inputs and outputs, verbatim
- Run-level metadata: model, memory backend, env
Alerting and cost controls
Latency alerts
Set p95 latency thresholds per agent or per pipeline. Get notified via Slack, PagerDuty, or webhook when you exceed them — before users notice.
Spend cap alerts
Set daily or monthly LLM spend budgets. Alert at 80% threshold. Auto-pause agents at 100% if configured. Per-pipeline and account-level controls.
Tool error rate tracking
Track success/error/timeout rates per tool. See which API is flaking. Get notified on error rate spikes so you fix the integration, not just the agent.
Observability built in from day one
Full trace, latency stats, and cost tracking on the free tier.